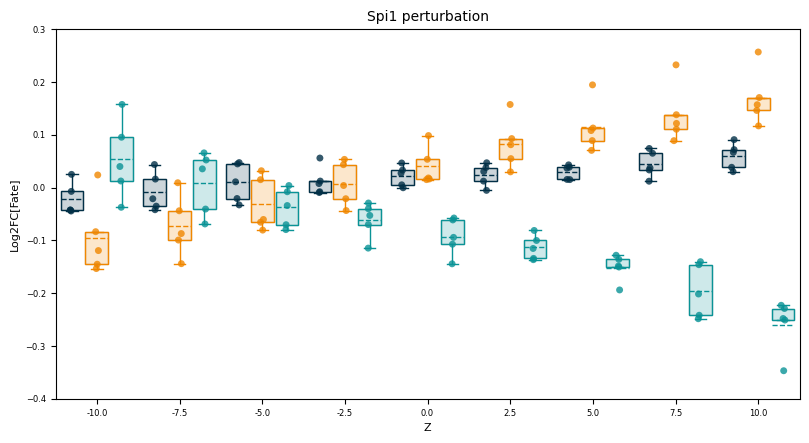
Figure 3J#
Perturb a single gene
Import libraries#
[1]:
import cellplots as cp
import larry
import matplotlib.pyplot as plt
import numpy as np
import pandas as pd
import scdiffeq as sdq
import scdiffeq_analyses as sdq_an
import scipy.stats
import torch
Get best ckpts#
[2]:
project_path = "./LightningSDE-FixedPotential-RegularizedVelocityRatio/"
project = sdq.io.Project(path = project_path)
best_ckpts = sdq_an.parsers.summarize_best_checkpoints(project)
best_ckpts
[2]:
| train | test | ckpt_path | epoch | |
|---|---|---|---|---|
| version_0 | 0.571656 | 0.551804 | LightningSDE-FixedPotential-RegularizedVelocit... | 2500 |
| version_1 | 0.541401 | 0.465658 | LightningSDE-FixedPotential-RegularizedVelocit... | 1706 |
| version_2 | 0.547771 | 0.499418 | LightningSDE-FixedPotential-RegularizedVelocit... | 1238 |
| version_3 | 0.496815 | 0.504075 | LightningSDE-FixedPotential-RegularizedVelocit... | 1245 |
| version_4 | 0.562102 | 0.522701 | LightningSDE-FixedPotential-RegularizedVelocit... | 1662 |
Get data, PCA model#
[3]:
h5ad_path = "./adata.reprocessed_19OCT2023.more_feature_inclusive.h5ad"

adata = sdq.io.read_h5ad(h5ad_path)
AnnData object with n_obs × n_vars = 130887 × 2492
    obs: 'Library', 'Cell barcode', 'Time point', 'Starting population', 'Cell type annotation', 'Well', 'SPRING-x', 'SPRING-y', 'clone_idx', 'fate_observed', 't0_fated', 'train'
    var: 'gene_ids', 'hv_gene', 'must_include', 'exclude', 'use_genes'
    uns: 'fate_counts', 'h5ad_path', 'time_occupance'
    obsm: 'X_clone', 'X_pca', 'X_umap', 'cell_fate_df'
    layers: 'X_scaled'
[4]:
PCA = sdq.io.read_pickle(path = "./pca_model.pkl")
/Users/mvinyard/.anaconda3/envs/scdiffeq/lib/python3.9/site-packages/sklearn/base.py:318: UserWarning: Trying to unpickle estimator PCA from version 1.0.2 when using version 1.2.2. This might lead to breaking code or invalid results. Use at your own risk. For more info please refer to:
https://scikit-learn.org/stable/model_persistence.html#security-maintainability-limitations
  warnings.warn(
Run perturbation scan using the five best model checkpoints#
[5]:
Perturbed = {}
for version, row in best_ckpts.iterrows():
    model = sdq.io.load_model(adata=adata, ckpt_path = row['ckpt_path'])
    result = sdq.tl.perturb_scan_z_range(
        adata = adata,
        model = model,
        seed = 0,
        N = 2000,
        t_sim = torch.linspace(2, 6, 41),
        obs_key = "Cell type annotation",
        subset_key = "Cell type annotation",
        subset_val = "Undifferentiated",
        gene_id_key = "gene_ids",
        genes = ['Spi1'],
        PCA = PCA,
        z_range = np.linspace(-10, 10, 9)
    )
    Perturbed[version] = result
 - [INFO] | Input data configured.
 - [INFO] | Bulding Annoy kNN Graph on adata.obsm['train']
Seed set to 0
 - [INFO] | Using the specified parameters, LightningSDE-FixedPotential-RegularizedVelocityRatio has been called.
 - [INFO] | Input data configured.
 - [INFO] | Bulding Annoy kNN Graph on adata.obsm['train']
Seed set to 0
 - [INFO] | Using the specified parameters, LightningSDE-FixedPotential-RegularizedVelocityRatio has been called.
 - [INFO] | Input data configured.
 - [INFO] | Bulding Annoy kNN Graph on adata.obsm['train']
Seed set to 0
 - [INFO] | Using the specified parameters, LightningSDE-FixedPotential-RegularizedVelocityRatio has been called.
 - [INFO] | Input data configured.
 - [INFO] | Bulding Annoy kNN Graph on adata.obsm['train']
Seed set to 0
 - [INFO] | Using the specified parameters, LightningSDE-FixedPotential-RegularizedVelocityRatio has been called.
 - [INFO] | Input data configured.
 - [INFO] | Bulding Annoy kNN Graph on adata.obsm['train']
Seed set to 0
- [INFO] | Using the specified parameters, LightningSDE-FixedPotential-RegularizedVelocityRatio has been called.
[6]:
sdq.io.write_pickle(obj = Perturbed, path = "Spi1.perturb.z_scan.pkl")
[2]:
Perturbed = sdq.io.read_pickle("./Spi1.perturb.z_scan.pkl")
[3]:
fates = ['Neutrophil', 'Monocyte', 'Baso']
PlotVals = {}
for version, result in Perturbed.items():
    PlotVals[version] = {}
    for fate in fates:
        fate_df = pd.DataFrame({z: result.stats.T[fate] for z, result in result.items()}).T
        PlotVals[version][fate] = list(fate_df['lfc'].values)


PlotValsReshaped = {}
for fate in fates:
    PlotValsReshaped[fate] = {i*4: list(row.values) for i, row in pd.DataFrame({k: v[fate] for k, v in PlotVals.items()}).iterrows()}
[7]:
fig, axes = cp.plot(
    1, 1, height = 1, width = 1.5, x_label=["Z"], y_label=["Log2FC[Fate]"], title = ['Spi1 perturbation'],
)
axes[0].set_xlim(-1, 35)
axes[0].set_ylim(-0.4, 0.3)
larry_cmap = larry.pl.InVitroColorMap()._dict
x_offsets = [-1.2, 0, 1.2]
for en, fate in enumerate(fates):
    bpl = cp.core.box_plot(
        data = PlotValsReshaped[fate],
        ax = axes[0],
        colors=[larry_cmap[fate]]*len(PlotValsReshaped[fate]),
        x_offset=x_offsets[en],
        box_widths=1.1,
    )
xt = axes[0].set_xticks(np.arange(1, 37, 4), [str(i) for i in np.linspace(-10, 10, 9)])
plt.savefig("LARRY.Spi1_perturbation.z_scan.svg")
Compute correlations#
Annotate the Figure 3J with the results
[5]:
x, y = {}, {}
for version, results in PlotVals.items():
    for fate, vals in results.items():
        if not fate in x:
            x[fate] = []
        if not fate in y:
            y[fate] = []
        _ = [x[fate].append(xi) for xi in np.linspace(-10, 10, 9).tolist()]
        _ = [y[fate].append(yi) for yi in vals]
[6]:
for fate in fates:
    corr, pval = scipy.stats.pearsonr(x[fate], y[fate])
    print("{:<10} | corr: {:<6} [pval: {:.3e}]".format(fate, round(corr, 3), pval))
Neutrophil | corr: 0.684  [pval: 2.280e-07]
Monocyte   | corr: 0.883  [pval: 1.034e-15]
Baso       | corr: -0.906 [pval: 1.182e-17]