def combine_expand(pvals):
stat, combined_pval = combine_pvalues(pvals, method="fisher")
return {"stat": stat, "combined_pval": combined_pval}
def prepare_stat_df_for_plotting(stats):
stats["x"] = stats["pooled_mean_lfc_re"]
stats["y"] = stats["combined_pval"].apply(np.log10) * -1
stats["significant"] = stats["combined_pval"] < 0.05
stats["insignificant"] = stats["combined_pval"] >= 0.05
stats["pos"] = stats["pooled_mean_lfc_re"] > 0
stats["neg"] = stats["pooled_mean_lfc_re"] <= 0
stats["sig.pos"] = stats["significant"] & stats["pos"]
stats["sig.neg"] = stats["significant"] & stats["neg"]
stats["insig.pos"] = stats["insignificant"] & stats["pos"]
stats["insig.neg"] = stats["insignificant"] & stats["neg"]
assert not any(stats[["sig.pos", "sig.neg", "insig.pos", "insig.neg"]].sum(1) > 1)
stats["group"] = stats[["sig.pos", "sig.neg", "insig.pos", "insig.neg"]].idxmax(1)
return stats
def plot(stats, xlim=(None, None), ylim=(-2, None)):
fig, axes = cp.plot(
1,
1,
height=0.5,
width=0.5,
delete=[["top", "right"]],
title=[
""
], # LARRY Neutrophil Fate Perturbation Screen (N=5, z=10)"], # Meta (5 models):
)
for group, group_df in stats.groupby("group"):
if "insig" in group:
c = "lightgrey"
elif "pos" in group:
c = "crimson"
elif "neg" in group:
c = "navy"
axes[0].scatter(
group_df["x"],
group_df["y"],
s=5,
ec="None",
c=c,
rasterized=True,
alpha=0.2,
)
axes[0].grid(True, alpha=0.2)
axes[0].set_xlim(xlim)
axes[0].set_ylim(ylim)
neg_highlight = stats[stats["sig.neg"]].sort_values("y").tail(15)
for i, row in neg_highlight.iterrows():
axes[0].scatter(row["x"], row["y"], s=15, c="navy", ec="None", rasterized=True)
axes[0].text(
x=row["x"] * 1.1,
y=row["y"] * 1.02,
s=row.name,
color="navy",
ha="right",
fontsize=6,
)
neg_highlight = stats[stats["sig.pos"]].sort_values("y").tail(15)
for i, row in neg_highlight.iterrows():
axes[0].scatter(
row["x"], row["y"], s=15, c="crimson", ec="None", rasterized=True
)
axes[0].text(
x=row["x"] * 1.1, y=row["y"] * 1.02, s=row.name, color="crimson", fontsize=6
)
axes[0].hlines(y=-np.log10(0.05), xmin=-2, xmax=2, color="k", ls="--", lw=1)
# plt.savefig("LARRY.neu_screen.meta_analysis.svg", dpi=500)
def compute_lfc(ctrl, prtb, constant: float = 1e-9):
return (prtb + constant).div((ctrl + constant)).apply(np.log2)
def compute_pval(ctrl, prtb, fates):
return pd.Series(
{
fate: scipy.stats.ttest_ind(
ctrl[_fates].sum(1), prtb[_fates].sum(1), equal_var=False
)[1]
for fate, _fates in fates.items()
}
)
def augment(df, all_fates):
for col in all_fates:
if not col in df:
df[col] = 0
return df
def augment_fate_dfs(perturbation_experiment, all_fates):
ctrl = augment(perturbation_experiment.ctrl.T, all_fates=all_fates)
prtb = augment(perturbation_experiment.prtb.T, all_fates=all_fates)
return ctrl, prtb
def compute_lfc_grouped_fate(ctrl, prtb, fates: List):
lfc = compute_lfc(ctrl[fates].sum(1), prtb[fates].sum(1))
return lfc.mean(), lfc.std()
def compute_grouped_stats(perturbation_experiment, fate_groups: Dict):
all_fates = fate_groups["MEP"] + fate_groups["GMP"]
ctrl, prtb = augment_fate_dfs(perturbation_experiment, all_fates=all_fates)
LFCStatDict_mean = {}
LFCStatDict_std = {}
for fate_group, fates in fate_groups.items():
lfc, lfc_std = compute_lfc_grouped_fate(ctrl, prtb, fates=fates)
LFCStatDict_mean[fate_group] = lfc
LFCStatDict_std[fate_group] = lfc_std
lfc = pd.Series(LFCStatDict_mean)
lfc_std = pd.Series(LFCStatDict_std)
pvals = compute_pval(ctrl, prtb, fates=fate_groups)
stats = pd.DataFrame([pvals, lfc, lfc_std]).T.rename(
{0: "pval", 1: "lfc", 2: "lfc_std"}, axis=1
)
return stats
class RawScreenProcessor(ABCParse.ABCParse):
"""Processed pkl to .csv"""
def __init__(self, results_dir: Union[pathlib.Path, str], *args, **kwargs):
self.__parse__(locals())
self._initialize_directory_structure()
@property
def results_dir(self):
return pathlib.Path(self._results_dir)
@property
def pkl_dir(self):
return self.results_dir.joinpath("pkl")
@property
def csv_dir(self):
return self.results_dir.joinpath("csv")
def _initialize_directory_structure(self):
"""/pkl/ subdir should already exist, so we shouldn't create it here."""
if not self.csv_dir.exists():
self.csv_dir.mkdir()
@property
def _discovered_csv_paths(self):
return sorted(list(self.csv_dir.glob("*.csv")))
@property
def pkl_paths(self):
return sorted(list(self.pkl_dir.glob("*.pkl")))
# def _process_attribute(self, file, key):
# return (
# pd.DataFrame({gene: result.stats[key] for gene, result in file.items()})
# .fillna(0)
# .T
# )
def _preprocess_grouped_fates_file(self, screen_file):
fates = {"MEP": ["Meg", "Ery"], "GMP": ["Mon", "Neu", "Bas"]}
Stats = {}
for gene, expt in tqdm.notebook.tqdm(screen_file.items()):
Stats[gene] = compute_grouped_stats(expt, fates)
MEP = (
pd.DataFrame({gene: stat.loc["MEP"] for gene, stat in Stats.items()})
.T.reset_index()
.rename({"index": "gene"}, axis=1)
)
GMP = (
pd.DataFrame({gene: stat.loc["GMP"] for gene, stat in Stats.items()})
.T.reset_index()
.rename({"index": "gene"}, axis=1)
)
results = {"MEP": MEP, "GMP": GMP}
return results
def _get_n(self, file, gene):
return np.unique([file[gene].ctrl.shape[1], file[gene].prtb.shape[1]])[0]
def _read_and_process_raw_pkl_files(self):
fpath = pathlib.Path("./v3_screen_results.human_hematopoiesis/preprocessed.pkl")
if fpath.exists():
ScreenResults = sdq.io.read_pickle(fpath)
else:
ScreenResults = {}
attr_cols = ["lfc", "lfc_std", "pval"]
for pkl_path in self.pkl_paths:
version = pkl_path.name.split("version_")[-1].split(".")[0]
version = f"version_{version}"
file = sdq.io.read_pickle(pkl_path)
ScreenResults[version] = self._preprocess_grouped_fates_file(file)
sdq.io.write_pickle(
ScreenResults,
"./v3_screen_results.human_hematopoiesis/preprocessed.pkl",
)
return ScreenResults
def __call__(self, *args, **kwargs):
self.__update__(locals())
return self._read_and_process_raw_pkl_files()
def process_raw_results(results_dir: str):
raw_screen_processor = RawScreenProcessor(results_dir=results_dir)
return raw_screen_processor()
def aggr_fate_statistics(results, fate):
_aggr_fate_frames = []
for version, frame in results.items():
fate_version_frame = (
frame["lfc"][fate]
.to_frame()
.reset_index()
.rename({"index": "gene", fate: "lfc"}, axis=1)
)
fate_version_frame["model"] = version
fate_version_frame["pval"] = frame["pval"][fate].values
fate_version_frame["se"] = (
frame["lfc_std"][fate].div(np.sqrt(frame["lfc_std"]["n"])).values
)
_aggr_fate_frames.append(fate_version_frame)
return pd.concat(_aggr_fate_frames)
def adjust_negative_i2(meta_results_df):
i2 = np.zeros(len(meta_results_df))
mask = meta_results_df["i2"] > 0
pos_i2 = meta_results_df.loc[mask]["i2"].values
i2[mask] = pos_i2
meta_results_df["i2"] = i2
def run_meta_analysis(aggr_stats):
meta_analysis_results = []
for gene in aggr_stats["gene"].unique():
gene_df = aggr_stats.loc[aggr_stats["gene"] == gene]
effect = gene_df["lfc"].values
variance = (gene_df["se"] ** 2).values
res_re = statsmodels.stats.meta_analysis.combine_effects(
effect=effect, variance=variance, method_re="iterated"
)
conf_int = np.array(res_re.conf_int())
ci_low, ci_high = conf_int[:, 0], conf_int[:, 1]
meta_analysis_results.append(
{
"gene": gene,
"pooled_mean_lfc_re": res_re.mean_effect_re,
"ci_low": ci_low[0], # Accessing the first element for CI
"ci_high": ci_high[0], # Accessing the first element for CI
"i2": res_re.i2,
"q": res_re.q,
}
)
meta_results_df = pd.DataFrame(meta_analysis_results).set_index("gene")
adjust_negative_i2(meta_results_df)
return meta_results_df
def combine_expand(pvals):
stat, combined_pval = combine_pvalues(pvals, method="fisher")
return {"stat": stat, "combined_pval": combined_pval}
def prepare_stat_df_for_plotting(stats):
stats["x"] = stats["pooled_mean_lfc_re"]
stats["y"] = stats["combined_pval"].apply(np.log10) * -1
stats["significant"] = stats["combined_pval"] < 0.05
stats["insignificant"] = stats["combined_pval"] >= 0.05
stats["pos"] = stats["pooled_mean_lfc_re"] > 0
stats["neg"] = stats["pooled_mean_lfc_re"] <= 0
stats["sig.pos"] = stats["significant"] & stats["pos"]
stats["sig.neg"] = stats["significant"] & stats["neg"]
stats["insig.pos"] = stats["insignificant"] & stats["pos"]
stats["insig.neg"] = stats["insignificant"] & stats["neg"]
assert not any(stats[["sig.pos", "sig.neg", "insig.pos", "insig.neg"]].sum(1) > 1)
stats["group"] = stats[["sig.pos", "sig.neg", "insig.pos", "insig.neg"]].idxmax(1)
return stats
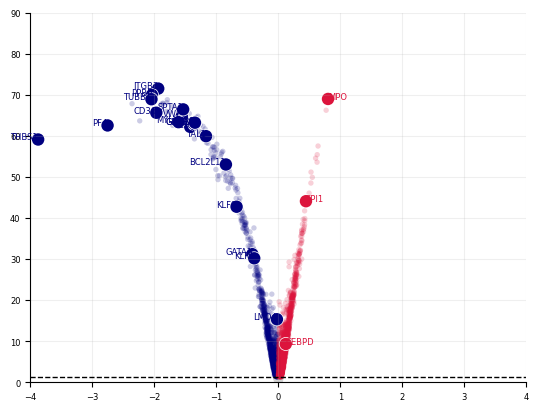
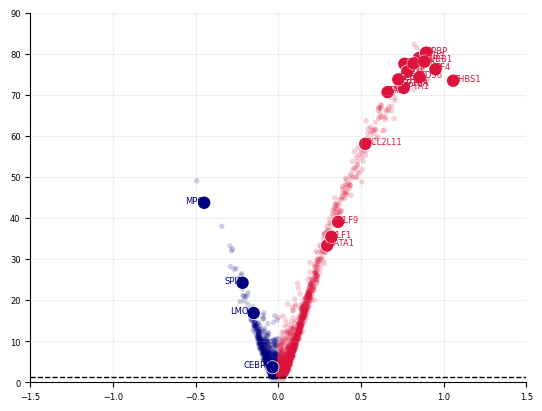
def plot_volcano(
stats, xlim=(None, None), ylim=(-2, None), savepath=None, highlight_genes=[]
):
fig, axes = cp.plot(
1,
1,
height=1,
width=1,
delete=[["top", "right"]],
title=[
""
], # LARRY Neutrophil Fate Perturbation Screen (N=5, z=10)"], # Meta (5 models):
)
for group, group_df in stats.groupby("group"):
if "insig" in group:
c = "lightgrey"
elif "pos" in group:
c = "crimson"
elif "neg" in group:
c = "navy"
axes[0].scatter(
group_df["x"],
group_df["y"],
s=15,
ec="None",
c=c,
rasterized=True,
alpha=0.2,
)
axes[0].grid(True, alpha=0.2)
axes[0].set_xlim(xlim)
axes[0].set_ylim(ylim)
stats_highlight = stats.loc[highlight_genes].copy()
neg_highlight = stats_highlight[stats_highlight["sig.neg"]]
for i, row in neg_highlight.iterrows():
axes[0].scatter(row["x"], row["y"], s=100, c="w", ec="None", rasterized=False)
axes[0].scatter(row["x"], row["y"], s=80, c="navy", ec="None", rasterized=False)
axes[0].text(
x=row["x"],
y=row["y"],
s=row.name,
color="navy",
ha="right",
fontsize=6,
)
pos_highlight = stats_highlight[stats_highlight["sig.pos"]]
for i, row in pos_highlight.iterrows():
axes[0].scatter(row["x"], row["y"], s=100, c="w", ec="None", rasterized=False)
axes[0].scatter(
row["x"], row["y"], s=80, c="crimson", ec="None", rasterized=False
)
axes[0].text(x=row["x"], y=row["y"], s=row.name, color="crimson", fontsize=6)
axes[0].hlines(
y=-np.log10(0.05), xmin=xlim[0], xmax=xlim[1], color="k", ls="--", lw=1
)
if savepath:
plt.savefig(savepath, dpi=500)
class MetaAnalysis(ABCParse.ABCParse):
def __init__(
self,
results_dir: str = "./v3_screen_results.human_hematopoiesis",
*args,
**kwargs,
):
self.__parse__(locals())
self.results = process_raw_results(self.results_dir)
def revised_aggr_fate_statistics(self, results, fate):
_aggr_fate_frames = []
for version, result in results.items():
frame = result[fate]
frame["model"] = version
frame["se"] = frame["lfc_std"].div(np.sqrt(10)).values
_aggr_fate_frames.append(frame)
aggr_fate_frames = (
pd.concat(_aggr_fate_frames).reset_index().drop("index", axis=1)
)
return aggr_fate_frames
@property
def results_dir(self):
results_dir = pathlib.Path(self._results_dir)
if not results_dir.exists():
results_dir.mkdir()
return results_dir
def _combine_pvals(self, aggr):
return aggr.groupby("gene")["pval"].apply(combine_expand).unstack()
@property
def aggr(self):
if not hasattr(self, "_attr"):
self._attr = self.revised_aggr_fate_statistics(
self.results, fate=self._fate
)
return self._attr
def forward(self, fate):
self._fate = fate
meta = run_meta_analysis(self.aggr)
combined_pvals = self._combine_pvals(self.aggr)
stats = pd.concat(
[
meta["pooled_mean_lfc_re"],
combined_pvals["combined_pval"],
],
axis=1,
)
return prepare_stat_df_for_plotting(stats)